
Profit-First Menu Redesign: Reprice Top Ten Dishes by Contribution Margin
By MenulabFebruary 27, 2026
Why prioritize contribution margin over food cost percent
Food cost percent is useful for purchasing and portion control. Contribution margin shows what each dish actually contributes to covering labor, rent, utilities, and profit. For top-ten items that drive revenue, using contribution margin delivers clearer decisions about pricing and promotion.
Step-by-step worksheet to reprice your top ten dishes
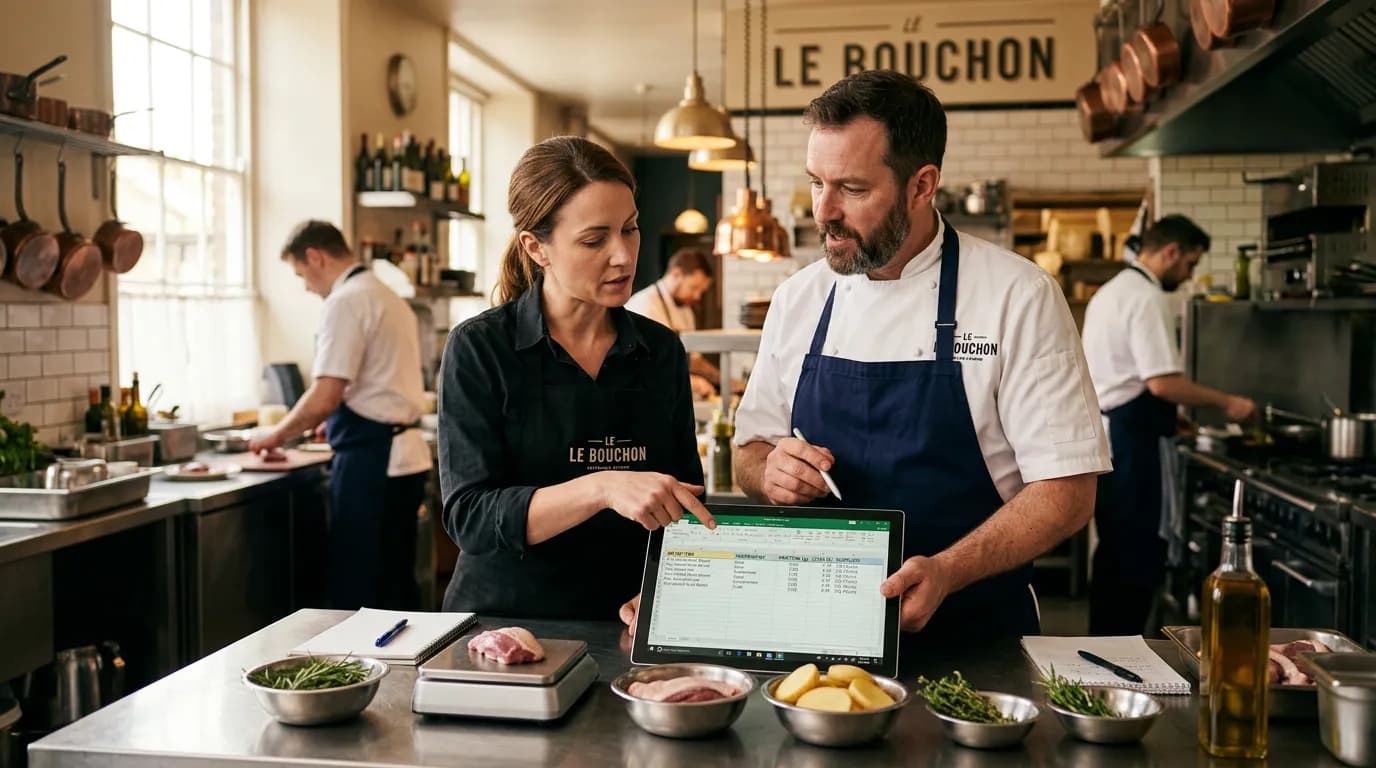
Build a single-sheet worksheet in Excel or Google Sheets and populate it with the last 30 days of actual sales and portion-standardized costs. Use this worksheet to calculate contribution margin per plate and contribution margin percent per plate. Below are the essential data columns and formulas.
Worksheet columns and formulas
- Item name and SKU: exact recipe reference used in prep
- Standard portion and yield notes: grams or counts per plate
- Ingredient cost per plate: sum(cost per unit * quantity used) divided by yield
- Menu price: current posted price and proposed price field for scenario testing
- Contribution margin and percent: Contribution = Menu price minus Ingredient cost per plate. Contribution % = Contribution divided by Menu price.
Worked example
Chicken Parmesan example using standardized portions. Ingredient cost per plate equals $4.50. Current menu price is $18.00. Contribution margin = 18.00 minus 4.50 = 13.50. Contribution percent = 13.50 divided by 18.00 = 0.75 or 75%.
Run two scenarios: a 5% price increase and a 10% price increase. Recalculate contribution and contribution percent for each scenario. Note the absolute contribution increase in dollars and the percent change in sales you can tolerate before revenue falls below the current contribution dollars.
How to reposition items on the menu map
Create a simple menu matrix using two axes: popularity and contribution percent. Popularity is sales volume or item count over the lookback period. Use median splits so quadrants reflect your menu's distribution.
Decision rules for the four quadrants
- High popularity, high contribution: promote via prime placement and consider incremental price tests
- High popularity, low contribution: reduce ingredient waste, slightly reprice, or increase perceived value with sides upsells
- Low popularity, high contribution: rework presentation and cross-promote; test as a rotating special
- Low popularity, low contribution: simplify recipe, cut portion, or remove
Practical repricing techniques that preserve demand
When adjusting prices, follow small, measurable steps. For full-service restaurants consider 3 to 7 percent increments. For cafes and quick service consider psychological pricing rounding such as .95 or .49. Always model the change: compute how many fewer sales you can afford while keeping contribution dollars neutral.
Example calculation: Current contribution per plate 13.50. After a 5 percent price rise to 18.90 contribution becomes 18.90 minus 4.50 = 14.40. You can lose up to 6.25 percent of unit sales and still match previous contribution. That figure equals 1 minus old contribution divided by new contribution: 1 minus 13.50/14.40 = 0.0625.
Setting target margins for specials and limited-time offers
Specials should be easier to cost control, so set a target contribution percent that reflects your operation. Practical targets:
• For full-service restaurants target 60 to 70 percent contribution percent. For high-volume cafes target 55 to 65 percent. For low-labor specials you can push above 70 percent if perceived value supports it.
Price specials using shorter ingredient lists, crossover components already prepped, and portion control. Test specials as time-limited items and track both sales lift and incremental contribution dollars, not just sales count.
Implementation checklist to run in one shift
1. Export last 30 days of item sales and identify the top ten dishes by units sold. 2. Standardize portions for those ten recipes and update ingredient unit costs. 3. Fill the worksheet columns and compute contribution margins. 4. Place items on the popularity vs contribution matrix and apply the decision rules. 5. Implement one small price change or placement move and track daily performance for two weeks.
Make the worksheet your living tool: update costs weekly, and rerun the top-ten analysis monthly. Small, frequent adjustments protect guest perception while improving total contribution.
If you want a ready-to-use worksheet structure, copy the columns listed above into a spreadsheet now and run the chicken parmesan example to see the math in action. Track results for 14 days and iterate based on measured contribution change.
Frequently Asked Questions
Why use contribution margin instead of food cost percent?
Contribution margin shows the dollar amount each dish returns toward fixed costs and profit. Food cost percent only measures ingredient efficiency and can mislead decisions for high-margin, low-cost dishes.
How do I pick thresholds for high versus low contribution percent?
Use your kitchen's median contribution percent as a split point. For quick benchmarking full-service kitchens often see 55 to 70 percent. The median split makes the menu matrix specific to your business.
What if repricing causes a sales drop?
Model the dollar contribution change before you act, then test small price increases while monitoring sales for two weeks. Calculate how many fewer units you can tolerate and use placement or upsells to offset sensitivity.
How often should I update the worksheet?
Update ingredient costs weekly and rerun the top-ten contribution analysis monthly. Update placement and pricing decisions based on fresh data every 30 days.